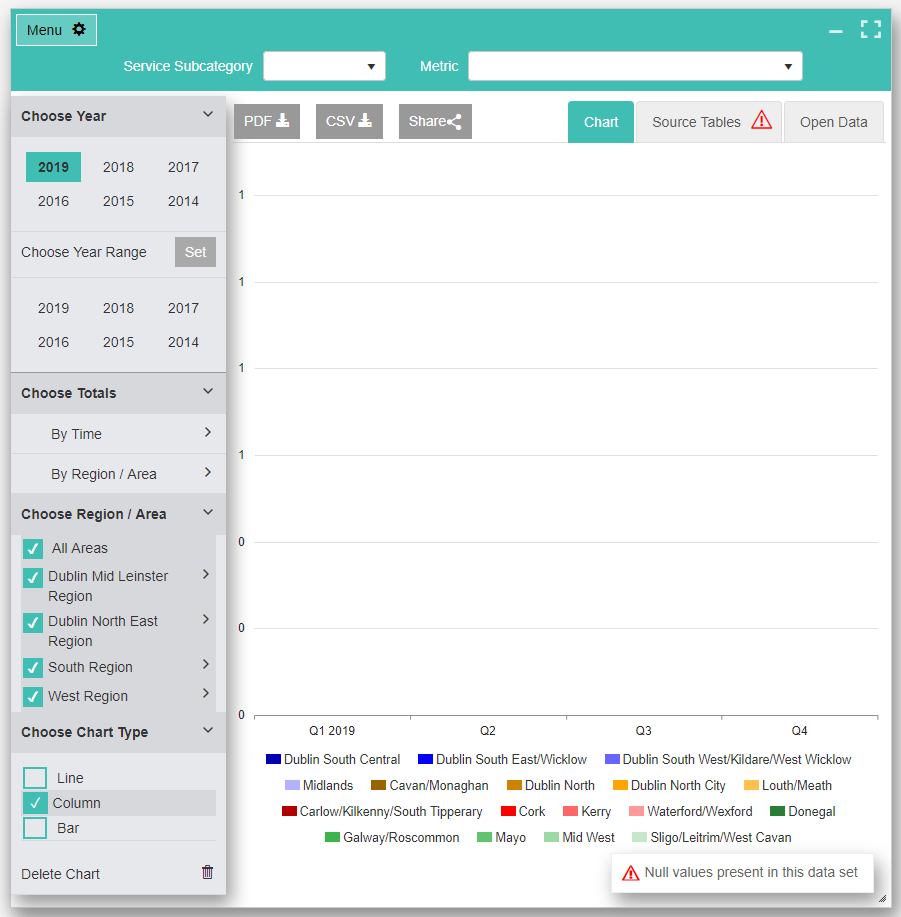
The Tusla Data Hub allows you to visualise our performance and activity open data as interactive charts.
These charts can be configured individually by year. Each “Metric” or dataset is categorised by Tusla Service Category and is available for you to explore.
Find your Metric
Find your Metric either by entering text or by using the dropdown option
OR
Choose a Service Category to Explore
Explore More
Add a chart
Chart layout
Minimized Charts
Menu
ACA
ACA Description
?
Metric
Service Subcategory
Choose Year
Choose Year Range
i
Due to geographical boundary changes in 2026, year range selection is restricted